The World AI Cannes Festival is back Feb 8-10 and we're there! See live updates on what's new in AI this year
.svg)
Design Thinking for visual analytics is a proven framework that puts the needs of end users at the forefront of development, enabling organizations to fail-fast, iterate, and design analytical solutions that can scale with excellence and sustain with improvement. Design thinking enables organizations to introduce agile ways of working, data fluency, value creation, and storytelling with data.
Some key concepts involved in Design Thinking:
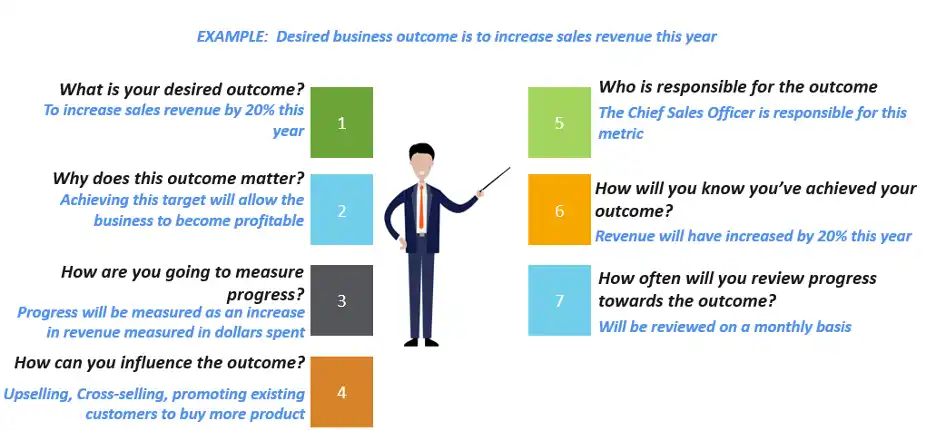
Visual analytics are essential for enabling users to take action and make data-driven decisions through insights and storytelling. Although visualization is at the forefront of most reporting products, there is a broad spectrum of needs and analytics use cases across any business, all of which are important. Visualizations are great, but a visualization is only effective if there is clear alignment on KPIs and how they can be leveraged. Developing KPIs is both an art and a science. The objective is to identify measures that can meaningfully communicate accomplishment of key goals and drive desired behaviors. Every KPI should relate to a specific business outcome with a performance measure. Unfortunately, KPIs are often confused with business metrics. Although often used in the same spirit, KPIs need to be defined according to critical or core business objectives, while metrics can provide insights that may feed into KPIs. KPIs and metrics can be at the organizational level and trickle down to other functional areas, as seen in the example below with Sales. Therefore, defining personas is a good exercise to understand the different needs of users across an organization.
A persona is a fictional character, rooted in research, that represents the needs and interests of your customer. It is created to represent a segment of users that might leverage a product in a similar way. Personas facilitate visualization of the user and create empathy with users throughout the design process.
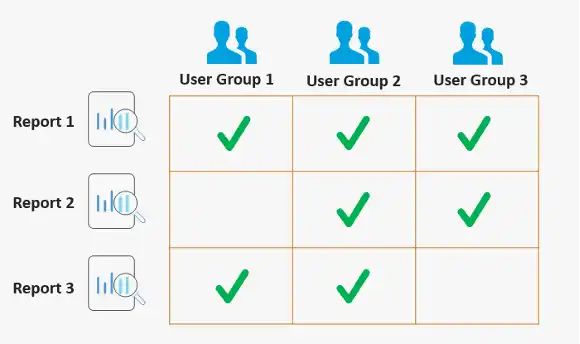
Developing personas helps gain an understanding for how different users within an organization leverage analytics. This is integral in designing user-centric applications that are organized by user’s needs with relevant content, combined from different sources.
A good persona accurately represents the user experience for a single or group of users taking into consideration the user needs to formulate requirements, design context, and complexity of situational behaviors.
By developing personas and understanding the needs of users, we can leverage different approaches to design analytics to guide the user through their desired experience. Whether it’s creating actionable KPIs to measure performance/progress or enabling the user to self-serve through a guided analytics experience, understanding their analytical needs will help drive the design of the solution.

One of the underlying principles of design thinking is putting the user’s needs first when designing & developing applications. Understanding the empathy of the user by mapping moments of frustration and delight throughout their analytical journey will help formulate the best experience possible.

A conceptual data model is a visual representation of concepts and rules that convey the makeup of a system or organization. Conceptual data models are key for defining, organizing, and prioritizing concepts and informational needs of the business.

Humans are innately visual creatures and often struggle to articulate their needs. Wireframing and prototypes are visual representation that define the experience with reporting and analytics and will visually depict the requirements or needs of a user in preparation for development.

A good iterative design process increases fidelity at each step to get closer to the final product that satisfies the needs of a user.

Design thinking is a framework that can be applied to almost every user-centric application. The biggest value an organization can recognize by instilling design thinking principles is understanding the needs and empathy of users as they begin to adopt analytics to enable a data-driven culture. If you’re curious how design thinking can be applied to your organization’s visual analytics and products, Launch has proven, strategic offerings to help you achieve your desired goals.
You’re in luck! Launch Consulting helps companies compete in a data-driven world. We turn information into insight through powerful analytics and data engineering and our Data & Analytics specialists create new opportunities for our clients out of untapped information tucked away across your business. Whether it’s capturing more market share or identifying unmet customer needs, effectively mining, and utilizing the data available to you will help you make faster, more informed decisions and keep pace with today’s rapidly changing business world. Click HERE to learn more about our D&A practice.

Design Thinking for visual analytics is a proven framework that puts the needs of end users at the forefront of development, enabling organizations to fail-fast, iterate, and design analytical solutions that can scale with excellence and sustain with improvement. Design thinking enables organizations to introduce agile ways of working, data fluency, value creation, and storytelling with data.
Some key concepts involved in Design Thinking:
Visual analytics are essential for enabling users to take action and make data-driven decisions through insights and storytelling. Although visualization is at the forefront of most reporting products, there is a broad spectrum of needs and analytics use cases across any business, all of which are important. Visualizations are great, but a visualization is only effective if there is clear alignment on KPIs and how they can be leveraged. Developing KPIs is both an art and a science. The objective is to identify measures that can meaningfully communicate accomplishment of key goals and drive desired behaviors. Every KPI should relate to a specific business outcome with a performance measure. Unfortunately, KPIs are often confused with business metrics. Although often used in the same spirit, KPIs need to be defined according to critical or core business objectives, while metrics can provide insights that may feed into KPIs. KPIs and metrics can be at the organizational level and trickle down to other functional areas, as seen in the example below with Sales. Therefore, defining personas is a good exercise to understand the different needs of users across an organization.
A persona is a fictional character, rooted in research, that represents the needs and interests of your customer. It is created to represent a segment of users that might leverage a product in a similar way. Personas facilitate visualization of the user and create empathy with users throughout the design process.
Developing personas helps gain an understanding for how different users within an organization leverage analytics. This is integral in designing user-centric applications that are organized by user’s needs with relevant content, combined from different sources.
A good persona accurately represents the user experience for a single or group of users taking into consideration the user needs to formulate requirements, design context, and complexity of situational behaviors.
By developing personas and understanding the needs of users, we can leverage different approaches to design analytics to guide the user through their desired experience. Whether it’s creating actionable KPIs to measure performance/progress or enabling the user to self-serve through a guided analytics experience, understanding their analytical needs will help drive the design of the solution.
One of the underlying principles of design thinking is putting the user’s needs first when designing & developing applications. Understanding the empathy of the user by mapping moments of frustration and delight throughout their analytical journey will help formulate the best experience possible.
A conceptual data model is a visual representation of concepts and rules that convey the makeup of a system or organization. Conceptual data models are key for defining, organizing, and prioritizing concepts and informational needs of the business.
Humans are innately visual creatures and often struggle to articulate their needs. Wireframing and prototypes are visual representation that define the experience with reporting and analytics and will visually depict the requirements or needs of a user in preparation for development.
A good iterative design process increases fidelity at each step to get closer to the final product that satisfies the needs of a user.
Design thinking is a framework that can be applied to almost every user-centric application. The biggest value an organization can recognize by instilling design thinking principles is understanding the needs and empathy of users as they begin to adopt analytics to enable a data-driven culture. If you’re curious how design thinking can be applied to your organization’s visual analytics and products, Launch has proven, strategic offerings to help you achieve your desired goals.
You’re in luck! Launch Consulting helps companies compete in a data-driven world. We turn information into insight through powerful analytics and data engineering and our Data & Analytics specialists create new opportunities for our clients out of untapped information tucked away across your business. Whether it’s capturing more market share or identifying unmet customer needs, effectively mining, and utilizing the data available to you will help you make faster, more informed decisions and keep pace with today’s rapidly changing business world. Click HERE to learn more about our D&A practice.
